Strategy charting is a powerful tool for strategy's graphical analysis. It can draw a chart of profit/loss and Greeks in strategy terms. To open a strategy chart you should select one or more strategies and click the Chart button on the toolbar above positions table (Fig. 1).
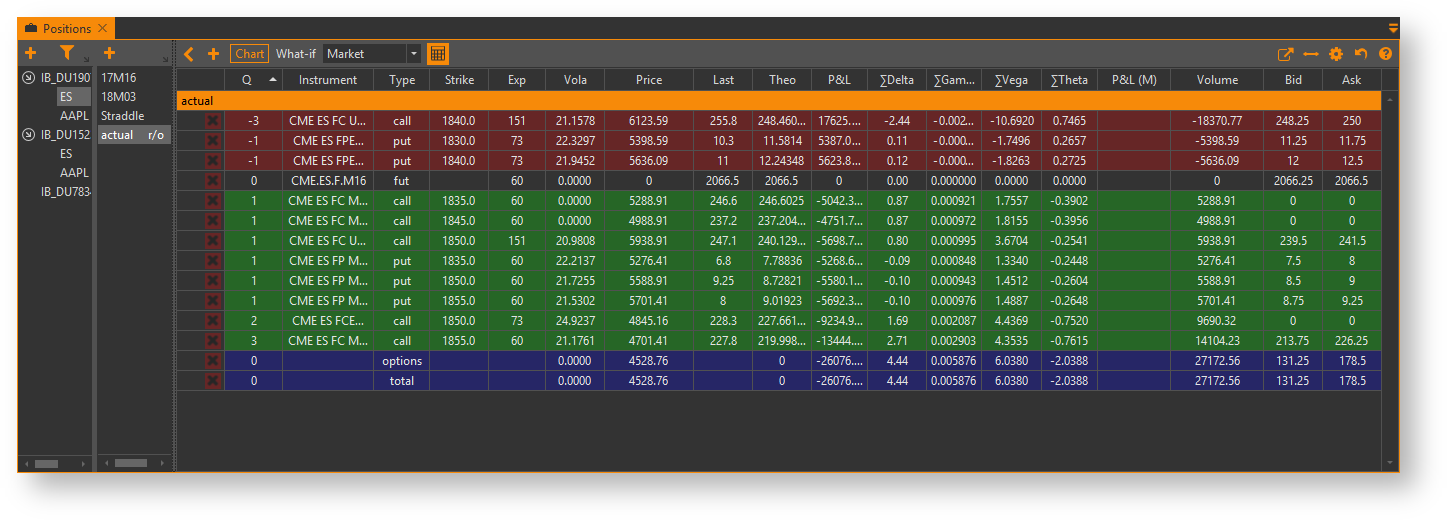
Fig. 1 – opening a strategy chart
After that, a strategy chart window will open (Fig. 2).
Fig. 2 – strategy chart window
Initially, it shows charts of profilt/loss, Delta, Gamma and Vega, but you may select which charts should be displayed using the buttons PnL, Delta, GammaL, VegaL and Theta on the bottom toolbar.
You may zoom the chart in and out using the mouse wheel and drag it using the mouse. You also can zoom into specific area by selecting a rectangle with the mouse while holding down the Ctrl key. If you want to maintain horizontal and vertical zoom ratio, then use the Shift key instead of Ctrl. You may return to default sizing and positioning anytime you want by opening the chart menu by right-clicking on the chart area and selecting the Fit to view command. You may reset whole chart at once by clicking the Fit to view button in the bottom toolbar.
Initially, the strategy chart shows only market chart lines, but you may add more chart lines using what-if scenarios (Fig. 3). Expand What-if scenarios selector in the top toolbar and select the what-if scenarios you want to display. Note that there is market scenario, which represents the current market situation. If no user scenarios are selected, then market scenario will be selected automatically. After you make your selections, click  on the top toolbar or click the pop-up button labeled Click to apply changes (Fig. 4 and 5).
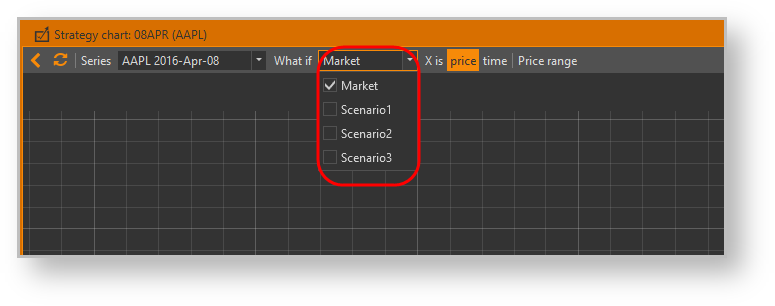
Fig. 3 – chart lines Fig. 4 – appling changes Fig. 5 – result of appling
Read more about what-if scenarios
There are other handy options to work with:
- You can select the X-axis range using drop-down lists in the top toolbar;
- You can refresh the charts manually by clicking on the top toolbar;
- Otherwise, you can set up the charts window to refresh automatically by timer. In order to achieve that, you should select refresh interval from the drop-down list on the bottom toolbar and check the Update every checkbox nearby;
If you're working with lots of strategies simultaneously, you may set different chart line parameters for each of them. Click the Line colors button on the bottom toolbar and the following dialog will pop-up (Fig. 3).
Fig. 6 – strategy lines setup
Here you can set line parameters, such as line color, thickness or style (solid, dashed, dotted, etc.) for the current date line and for the futures expiration date separately.
Basic chart settings, such as charts' visibility and X-axis range, are saved so you don't need to set them each time you open a strategy chart. Any other chart settings (selected what-if scenarios, chart line parameters, auto-refresh mode, charts' zooming and positioning) are reset when a strategy chart window is opened.
Note that if you have added or removed positions in selected strategies or edited their properties or edited what-if scenarios (even if they are currently selected), then refreshing charts will reflect those changes. So you don't need to reopen the strategy charts window every time you make any changes.
Overview
Content Tools